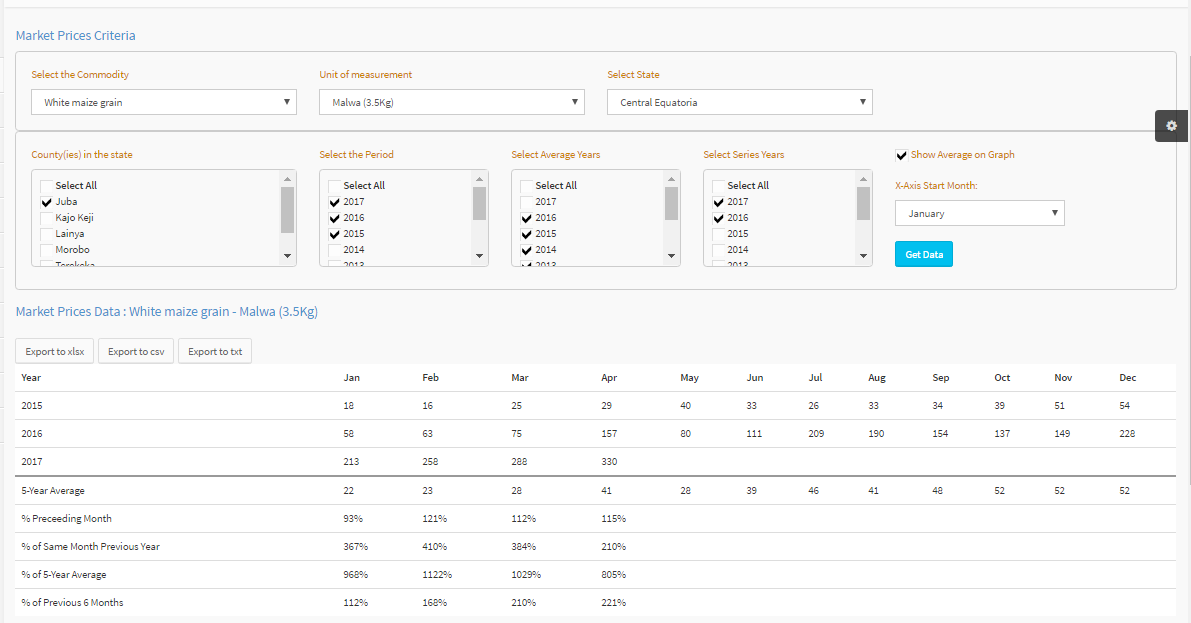
MARKET DATA
Involves analysis of price trends and changes of a single commodity by comparing current month price to the same month the previous year, the previous month, 6 months and 3-year monthly average. This helps to determine whether the current price trends are normal, lower/higher/ or following a seasonal patterns. The underlying causes in price trends are then inferred. Computationally, a price change/relative is calculated as follows:
% Price Change = (Current Price / Base Price - 1) * 100%
To access market data :
1. From the dashboard, click Market Data & Analysis - > Market Prices on the left side bar menu .
2. From the selection criteria section (the top part) select the following :
- - Commodity
- - Unit of measurement
- - State
- - Counties of interest based on the state selected
- - Period
- - Average years
- - Series
- - Check show average on graph (optional)
3. Click Get Data button


 CLiMIS